
HITS Digital is a browser-based dashboard and analytics platform that can be accessed from any workstation or mobile device. It is designed to provide real-time visibility into business performance through flexible reporting and data visualization tools.
HITS Digital includes:
- A fully customizable KPI dashboard
- A corporate-level KPI dashboard for multi-store locations
- Over 50 pre-defined analytics reports
- The ability to create custom analytics reports
- Powerful data visualization tools
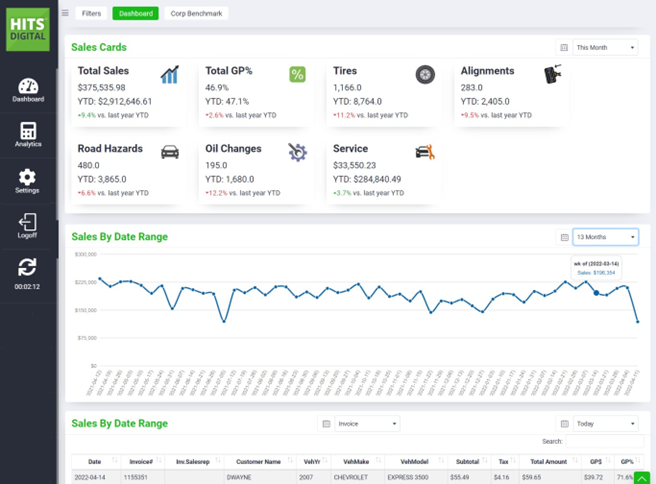
Dashboard Overview
Below the custom KPI sales cards on the HITS Digital Dashboard, a Sales Graph and Sales Table are displayed. These sections provide both a visual summary and a detailed breakdown of sales activity.
Both the graph and table can be customized using the Dashboard Filters, allowing users to refine and analyze performance data based on specific criteria.
Below the custom sales cards on the HITS Digital Dashboard, a graph and table of sales are displayed. These sections provide both visual and detailed breakdowns of sales activity and can be customized using the Dashboard Filters.
Dashboard Filters
The Dashboard Filters control which data is displayed across the dashboard, graph, and table. These filters allow users to narrow results and focus on specific segments of their business.
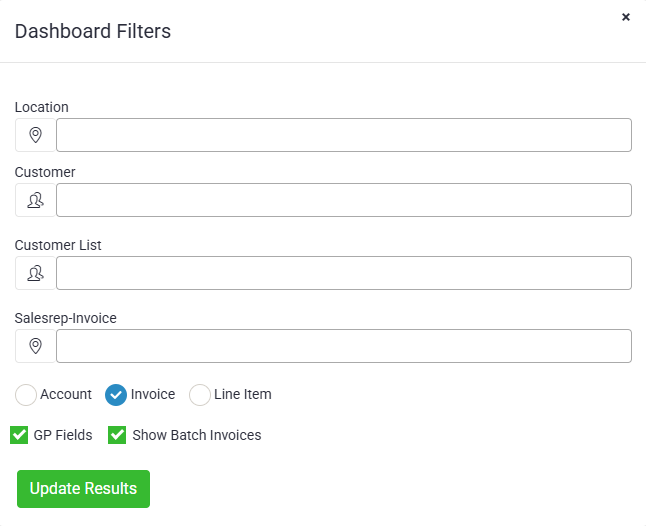
Filter Options:
- Location: Limits results to a specific store or branch location.
- Customer: Filters results for a specific customer account.
- Customer List: Allows selection from a predefined customer list for multi-customer analysis.
- Salesrep–Invoice: Filters sales results by a specific salesperson.
Display Options:
- Account / Invoice / Line Item: Choose the level of detail displayed in results.
- Account – summarizes by customer account.
- Invoice – displays totals by invoice (default selection).
- Line Item – provides the most detailed view per individual sale line.
Additional Filters:
- GP Fields: When checked, displays gross profit fields and related metrics in dashboard results.
- Show Batch Invoices: When checked, includes batch-closed invoices in the totals and graphs.
After applying or adjusting filters, click Update Results to refresh the dashboard with the filtered data.
Sales By Date: Sales Graph
The Sales Graph displays total sales ($) for the selected date range, based on invoices and batch-closed tickets.
- The graph’s date range is independent from the custom sales cards above.
- Results shown on the graph reflect any filters set in the Dashboard Filters tab.
- Example: If a specific sales representative is selected, the graph will only display that sales rep’s sales data.

Sales By Date: Sales Table
The final section of the dashboard is a Sales Table, which provides a detailed breakdown of all sales activity.
- The table can be displayed by Invoice, Department, or Manufacturer.
- The date range for this section is independent of the other sections and can be set to:
- Today
- Week to Date
- Month to Date
- Like the graph, this table also reflects any filters applied through the Dashboard Filters tab.

Use the Search Bar within the table to quickly locate results by Invoice #, Customer Name, or other fields.

HITS Digital is an add-on. Please reach out to Sales or Tech support for detailed information on cost.