The Daily Close Out Report summarizes a store’s daily sales activity, grouped by department and tender type. It provides a complete picture of sales totals, units sold, discounts, GP%, tendered amounts, and key performance metrics for the selected date range.
This report is helpful for reviewing end-of-day performance, validating tender totals, and reconciling sales across departments.
When to Use This Report
Use the Daily Close Out Report when you need to:
-
- Review daily or yearly sales totals
- Validate tendered payments (cash, checks, credit cards, misc.)
- Analyze sales by department
- Check KPIs such as ticket count, ARO (Average Repair Order), and GP%
- Confirm whether goods, services, or both were sold in a given period
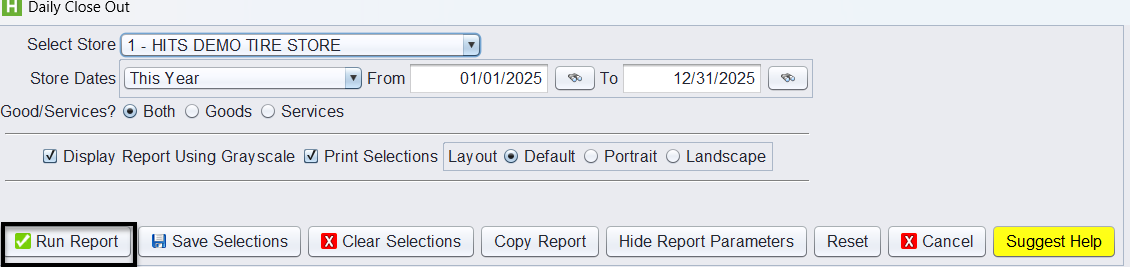
How to Run the Daily Close Out Report
1.) From the main menu, navigate to: Views → Reports → Recaps & Summaries → Daily Close Out
2.) Select Store: Choose the store you wish to run the report for.
3.) Store Dates: Select a preset range (e.g., Today, This Month, This Year)
4.) Goods/Services? Choose Both, Goods, or Services depending on the type of sales you want included.
5.) (Optional) Report Layout Options
6.) Click Run Report to generate the results.
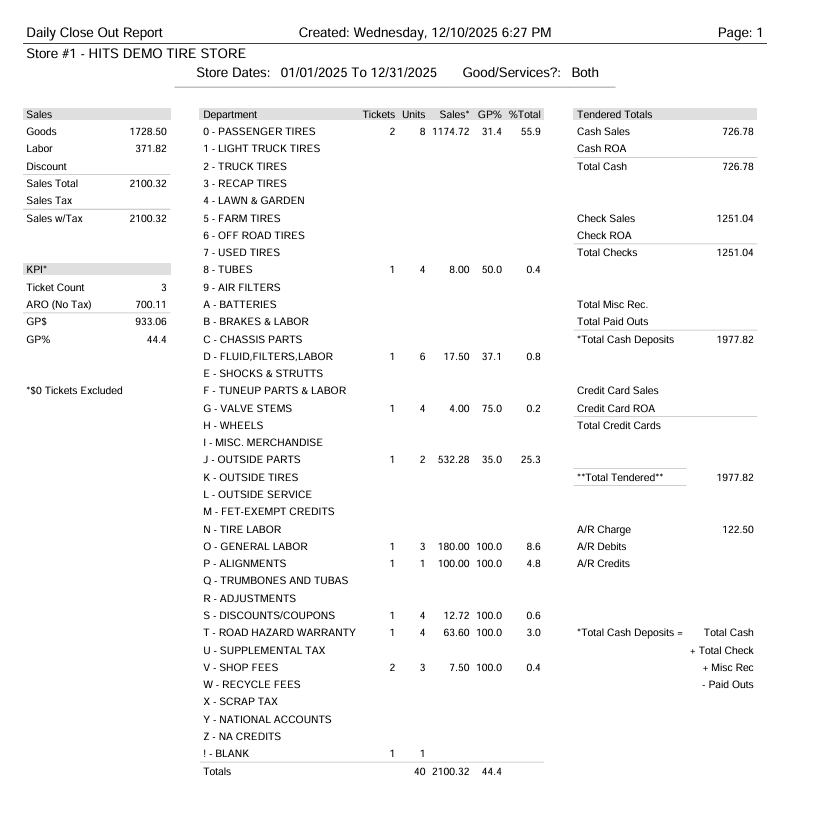
Understanding the Daily Close Out Report
The report is divided into several key sections:
1. Sales Summary
Displays high-level totals, including:
-
- Goods sales
- Labor sales
- Discounts
- Sales totals (with and without tax)
- Sales Tax
2. KPI Section
Shows performance metrics for the selected period:
-
- Ticket Count – number of invoices
- ARO (No Tax) – average sales per ticket (before tax)
- GP$ – gross profit dollars
- GP% – gross profit percentage
3. Department Breakdown
Each department displays:
-
- Tickets – number of repair orders/invoices
- Units – quantity sold
- Sales – total sales for that department
- GP% – gross profit percentage
- %Total – department’s share of overall sales
This allows you to see exactly which categories are generating revenue (e.g., Passenger Tires, Oil Filters, General Labor).
4. Tendered Totals
Shows how customers paid for the work:
-
- Cash Sales
- Check Sales
- Credit Card Sales
- Misc. Receipts
- Paid Outs
- Total Tendered values
These totals should match what was physically collected during the date range.
5. Grand Totals
At the bottom, the report summarizes:
-
- Total sales
- Total units
- Overall GP%
- Combined tender totals
This provides a complete financial snapshot of the store’s performance.