
The Department Recaps report provides a summary of all sales activity by department for the date range selected. It displays totals for all inventory items based on the department they are assigned.
Recommended Use
Run the Department Recaps report to:
-
- Review daily or monthly sales performance
- Compare profit margins between departments
- Analyze technician or salesrep production (optional filters)
- Identify low-margin departments or unusual activity
Most stores run this report daily, weekly, or for specific accounting periods.
How to Run the Department Recaps Report
Follow the steps below to generate the report:
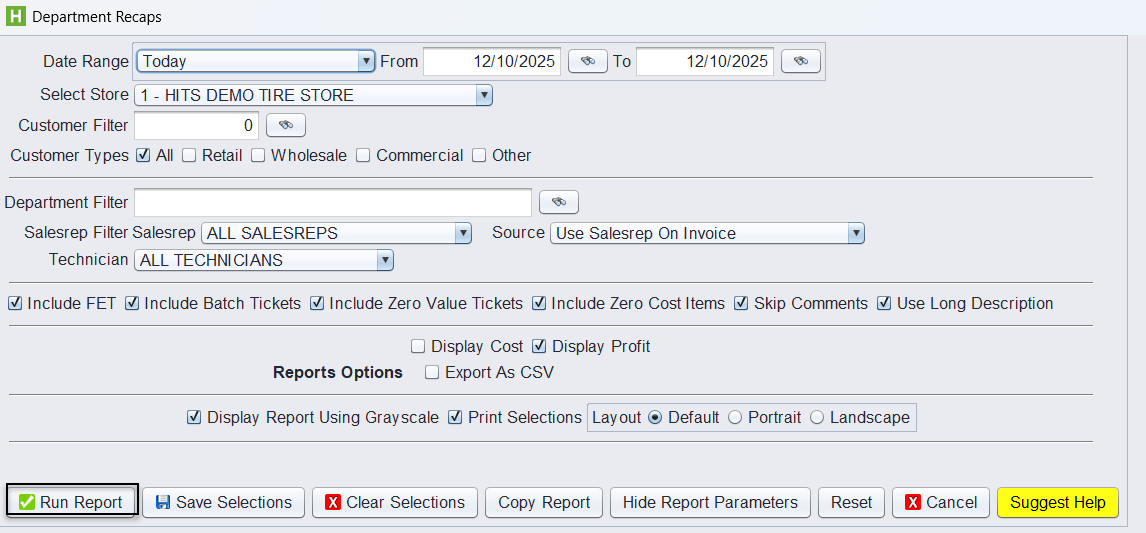
1.) From the main menu, go to Views → Reports → Recaps & Summaries → Department Recaps.
2.) Select the Date Range
3.) Select the Store
4.) Customer Filter (Optional)
5.) Customer Types: Select which types of customers to include.
6.) Department Filter (Optional): Enter a specific department if you want to limit the report to only one.
7.) Salesrep Filter / Source (Optional)
8.) Technician Filter (Optional)
9.) Additional Options
You may include or exclude specific line types:
-
- Include FET – Include Federal Excise Tax values.
- Include Batch Tickets – Include tickets that have been batch processed (if applicable)
- Include Zero Value Tickets – Include tickets with no sales amounts.
- Include Zero Cost Items – Include sales tickets that had products with no cost ($0).
- Skip Comments – Hide comment-only lines.
- Use Long Description – Show long version of inventory descriptions.
10.) Cost / Profit Display Options
- Display Cost – Show cost columns on the recap.
- Display Profit – Show profit totals and percentages.
11.) Report Options
- Export As CSV – Export data to Excel.
- Display Report Using Grayscale – Print-friendly view.
- Print Selections – Displays your filter criteria on the printed report.
- Layout – Default, Portrait, or Landscape.
12.) Click Run Report
Understanding the Report Layout
The Department Recaps report summarizes sales activity by department for the selected date range. It divides results into two major sections:
1. GOODS WITH FET
This section includes all Goods sales (tires, parts, filters, accessories, etc.) and provides the departments total FET amounts.
Common columns include:
-
- Sales – Total sales revenue for the goods in the specific department.
- Profit – Total profit (Sales – Cost).
- FET – Total Federal Excise Tax.
- GP% – Gross Profit percentage for the department.
- Units – Total number of items sold within that department.
2. SERVICES & OTHER
This section includes all sales for inventory items that are set up as a “Service”.
Columns include:
-
- Sales – Total revenue for the services in the specific department.
- Profit – Profit generated from the service line.
- GP% – Gross Profit percentage.
- Units – The number of service items sold.
3. OTHER COLUMNS
-
- # Tickets – Number of invoices that included items from this department.
- Veh Count – Number of vehicles serviced in that department (when applicable).
Each row represents a department. Departments are grouped by code, allowing you to quickly compare product and service performance.
At the bottom of the table, the Totals row summarizes:
-
- Total Sales
- Total Profit
- Total FET (if selected to “include FET”)
- Total GP%
- Total Units
These totals represent all activity for the selected date range.
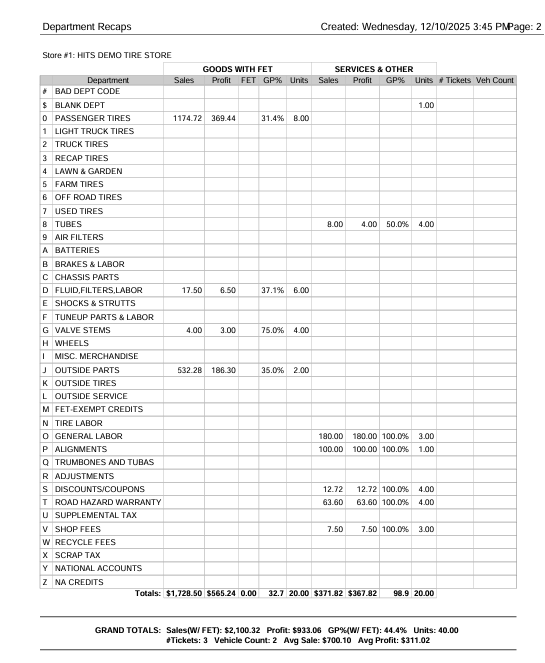
Grand Totals Summary (Bottom of Page)
A final summary appears at the bottom of the report showing:
-
- Sales (w/ FET) – Total revenue including FET (if selected to “include FET”)
- Sales (w/o FET) – Revenue excluding FET (if not selecting the “include FET” checkbox)
- Profit – Total profit across all departments
- GP% (w/ FET) – Overall gross profit percentage
- Units – Total number of units sold
- # Tickets – Total invoices included
- Vehicle Count – Number of vehicles serviced
- Avg Sale – Average invoice value
- Avg Profit – Average profit per invoice
This summary gives users an at-a-glance view of daily, weekly, or monthly performance.