
Below the custom cards on the HITS Digital dashboard, a graph and table of sales will be shown.
Filters
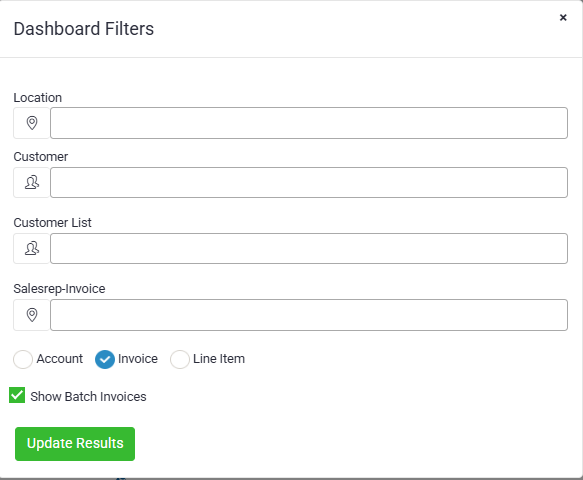
Click the Filters button at the top of the dashboard to refine the data displayed in your sales graph and sales table.

The Dashboard Filters window allows you to filter by:
-
- Location – View results for a specific store location.
- Customer – Filter results for a specific customer.
- Customer List – Apply filters to a saved customer list.
- Salesrep-Invoice – Display results for invoices associated with a specific sales representative.
Additional options:
-
- View Mode – Choose whether results are shown by Account, Invoice, or Line Item.
- Show/Hide GP Fields – Toggle the display of cards related to Gross Profit (GP$ and GP%).
- Show Batch Invoices – Toggle the inclusion of batch-closed invoices in results.
After selecting your filters, click Update Results to apply them. The sales graph and sales table will update automatically to reflect the applied filters.
Sales Graph
The sales graph will show total sales $ of the date range selected for invoices and batch closed tickets.
The date range for this graph is independent from the custom cards date range. This graph will be based on any filters set on the filters tab. For example, if a salesrep is set on the filters tab, the graph will show only that salesreps sales graph.

Sales Table
The last section on the dashboard will be a table of all sales.
This table can display by Invoice, Department, or Manufacturer. This table has an independent date range from the other section and can be viewed for sales for Today, Week To Date, or Month to Date. This table will also reflect any filters set on the filters tab.

Like all tables in HITS Digital, use the Search bar to search the table for invoice#, customer, etc.
